 02873009677
 contact@envyenglish.vn


1. Phân tích đề và nhóm số liệu
Đề bài
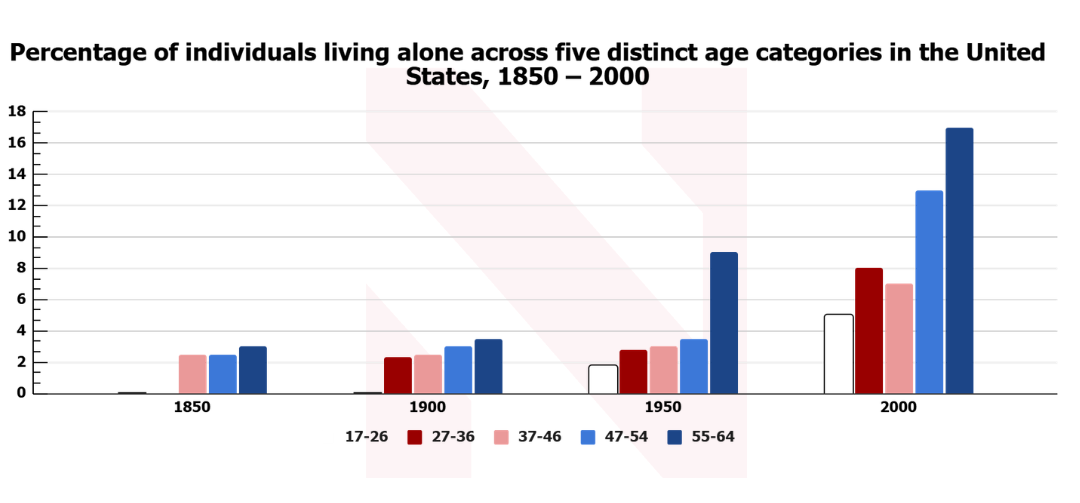
The chart shows the percentage of individuals living alone across five distinct age categories in the United States from 1850 to 2000.
Dạng biểu đồ
Bar Chart
Xác định đặc điểm tổng quan (Overview Features)
Đặc điểm nổi bật 1: Tỷ lệ người sống một mình tăng ở tất cả các nhóm tuổi trong suốt giai đoạn khảo sát, đặc biệt sau năm 1950.
Đặc điểm nổi bật 2: Nhóm 55–64 tuổi luôn có tỷ lệ cao nhất và ghi nhận mức tăng mạnh nhất, trong khi nhóm 17–26 tuổi duy trì mức thấp nhất ở hầu hết các mốc thời gian.
Chia nhóm dữ liệu cho các đoạn Thân bài (Data Grouping)
Body 1 Grouping: 1850–1950
Ý 1: 1850 và 1900
Ý 2: 1950
Body 2 Grouping: 1950–2000
Ý 1: Nhóm 55–64 và 47–54
Ý 2: Ba nhóm tuổi còn lại
Triển khai phân tích
Mở bài (Paraphrase)
The bar chart compares the percentages of people living alone in five age groups in the United States between 1850 and 2000.
(Tạm dịch: Biểu đồ cột so sánh tỷ lệ người sống một mình ở năm nhóm tuổi tại Hoa Kỳ trong giai đoạn từ năm 1850 đến năm 2000.)
Tóm tắt tổng quan (Overview)
Overall, the proportions of people living alone increased across all age groups over the period, with the most substantial growth occurring after 1950. In addition, individuals aged 55–64 consistently recorded the highest percentages, whereas the youngest age group generally remained the least likely to live alone.
(Tạm dịch: Nhìn chung, tỷ lệ người sống một mình tăng ở tất cả các nhóm tuổi trong suốt giai đoạn khảo sát, trong đó mức tăng mạnh nhất diễn ra sau năm 1950. Ngoài ra, nhóm từ 55–64 tuổi luôn có tỷ lệ cao nhất, trong khi nhóm trẻ nhất nhìn chung ít sống một mình nhất.)
2. Lập dàn ý chi tiết cho bài viết
Introduction
Paraphrase lại đề bài bằng cách thay thế shows → compares, individuals living alone → people living alone, across five distinct age categories → in five age groups.
Overview
Đặc điểm chung:
Tất cả các nhóm tuổi đều có xu hướng tăng.
Mức tăng rõ rệt nhất diễn ra sau năm 1950.
Điểm nổi bật:
Nhóm 55–64 luôn đứng đầu và tăng mạnh nhất.
Nhóm 17–26 duy trì tỷ lệ thấp nhất trong phần lớn thời gian.
Body Paragraph 1
Trật tự sắp xếp: 1850 → 1900 → 1950.
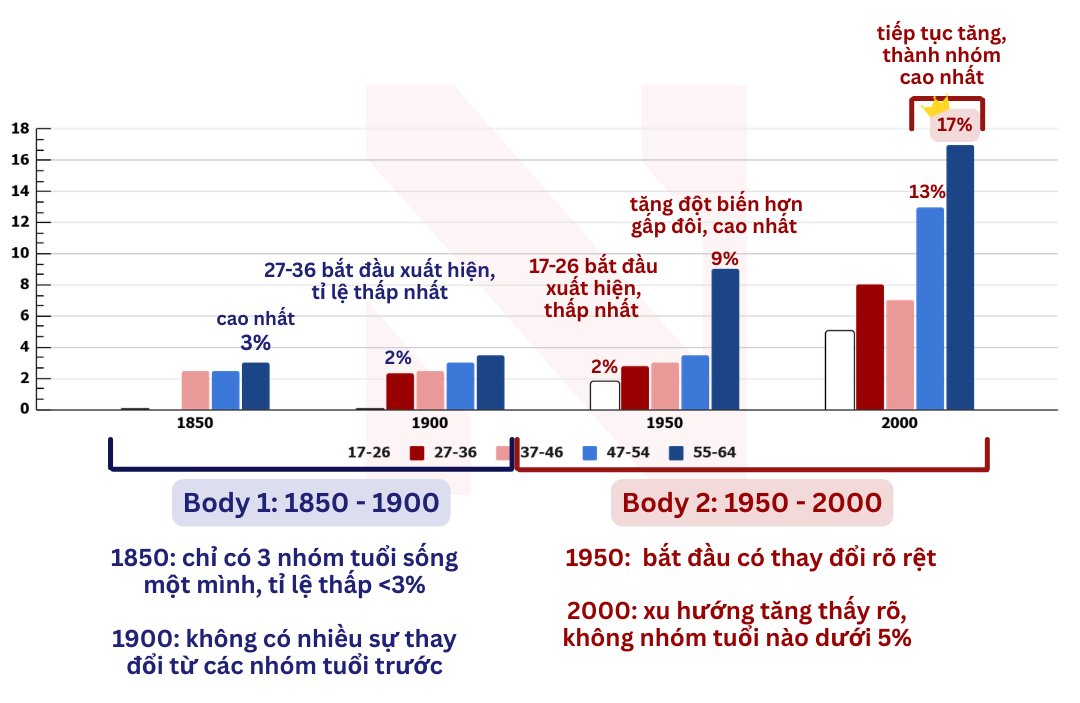
Topic sentence: During the first century, the proportions remained relatively low across all age groups.
Detail 1: In both 1850 and 1900, most figures were clustered at around 2–3%, with the 55–64 age group recording the highest proportion at roughly 3–3.5%.
Detail 2: By 1950, only modest increases were seen for most groups, which remained below 4%, whereas the figure for those aged 55–64 rose sharply to approximately 9%.
Body Paragraph 2
Trật tự sắp xếp: 55–64 & 47–54 → Remaining groups.
Topic sentence: The second half of the period witnessed much stronger growth, particularly among older adults.
Detail 1: By 2000, the proportion of people aged 55–64 living alone had almost doubled to around 17%, while the figure for the 47–54 group climbed markedly to approximately 13%.
Detail 2: The remaining age groups also experienced noticeable increases, reaching about 8% for those aged 27–36, 7% for the 37–46 group and roughly 5% among the youngest adults.
3. Bài mẫu hoàn chỉnh
The bar chart compares the percentages of people living alone in five age groups in the United States between 1850 and 2000.
Overall, the proportions of people living alone increased across all age groups over the period, with the most substantial growth occurring after 1950. Furthermore, the 55–64 age group consistently recorded the highest percentages, while the youngest adults generally remained the least likely to live alone.
During the first century, the figures remained relatively low across all age groups. In both 1850 and 1900, most percentages were clustered at around 2–3%, although the proportion for people aged 55–64 was slightly higher at approximately 3–3.5%. By 1950, only modest increases were observed for most groups, which still remained below 4%, whereas the figure for the oldest group rose sharply to about 9%.
Much stronger growth occurred during the second half of the period. By 2000, the percentage of individuals aged 55–64 living alone had climbed dramatically to nearly 17%, the highest figure shown. The 47–54 group also increased substantially to around 13%. Meanwhile, the remaining age groups reached approximately 8% for those aged 27–36, 7% for the 37–46 group and about 5% for people aged 17–26.
(Word count: 179)
4. Lexical Resources List
New Vocabulary
live alone (verb phrase): sống một mình
E.g. More people chose to live alone by 2000.
age group (noun phrase): nhóm tuổi
E.g. The oldest age group recorded the highest percentage.
proportion (noun): tỷ lệ
E.g. The proportion increased steadily over time.
cluster around (verb phrase): tập trung quanh một mức
E.g. Most figures clustered around 3%.
modest increase (noun phrase): sự gia tăng nhẹ
E.g. The younger groups experienced only a modest increase.
substantial growth (noun phrase): sự tăng trưởng đáng kể
E.g. Substantial growth occurred after 1950.
record the highest figure (verb phrase): ghi nhận mức cao nhất
E.g. The oldest group recorded the highest figure.
climb dramatically (verb phrase): tăng mạnh
E.g. The percentage climbed dramatically by the end of the period.
remain relatively low (verb phrase): duy trì ở mức tương đối thấp
E.g. The figures remained relatively low before 1950.
youngest adults (noun phrase): nhóm người trẻ nhất
E.g. The youngest adults had the lowest proportion.
older adults (noun phrase): nhóm người lớn tuổi
E.g. Older adults were more likely to live alone.
be the least likely to (verb phrase): ít có khả năng nhất
E.g. Young people were the least likely to live alone.
Sentence Structures
The bar chart compares the percentages of + people + in + categories + between + year + and + year. (Dùng để mở bài cho biểu đồ cột.)
E.g. The bar chart compares the percentages of people living alone in five age groups between 1850 and 2000.
Overall, the figures increased across all categories, with + category + recording the highest proportions throughout the period. (Dùng để viết Overview.)
E.g. Overall, the figures increased across all categories, with the oldest age group recording the highest proportions throughout the period.
During the early part of the period, most figures remained at around + number. (Dùng để mô tả giai đoạn đầu ít biến động.)
E.g. During the early part of the period, most figures remained at around 2–3%.
By + year, the figure for + category + had risen to approximately + number. (Dùng để mô tả mức tăng theo thời gian.)
E.g. By 1950, the figure for the 55–64 age group had risen to approximately 9%.
The most noticeable increase was seen in + category +, which climbed from + number + to + number. (Dùng để nhấn mạnh nhóm tăng mạnh nhất.)
E.g. The most noticeable increase was seen in the 55–64 group, which climbed from around 3% to nearly 17%.
Meanwhile, the remaining groups also experienced growth, reaching between + number + and + number + by the end of the period. (Dùng để gộp các nhóm có xu hướng tương tự.)
E.g. Meanwhile, the remaining groups also experienced growth, reaching between 5% and 13% by the end of the period.
Nếu bạn đang bắt đầu từ con số 0 hoặc đã học nhưng “dậm chân tại chỗ”, Envy English Center có thể đồng hành cùng bạn:
Test trình độ miễn phí theo format IELTS để biết chính xác điểm mạnh – điểm yếu.
Nhận lộ trình học cá nhân hóa từ 0 → 6.5+, phù hợp tốc độ và mục tiêu.
Trực tiếp học với giáo viên IELTS 8.0+, chuyên “gỡ rối” Speaking & Writing – hai kỹ năng khó nâng band nhất.
Đặc biệt, khi đăng ký trong tuần này, bạn được tặng bộ từ vựng chuẩn IELTS band 7+.
📞 Hotline: 028 7300 9677 / 0948 197 270 (Zalo)
🌐 Website: envyenglish.vn
📍 Địa chỉ: 46/5 Tân Cảng, Phường Thạnh Mỹ Tây, Quận Bình Thạnh, TP.HCM


Thông tin gửi đi không thành công, vui lòng thử lại sau.
Nếu bạn cần liên hệ gấp, vui lòng gọi hotline
02873009677

Cảm ơn bạn đã gửi thông tin đến Envy English Center.
Chúng tôi sẽ liên hệ với bạn sớm nhất khi có thể.
Nếu bạn cần liên hệ gấp, vui lòng gọi hotline
02873009677
Thông tin gửi đi không thành công, vui lòng thử lại sau.
Nếu bạn cần liên hệ gấp, vui lòng gọi hotline
02873009677
Bạn đang có một bài test chưa hoàn thành.
Bạn có muốn tiếp tục bài test đó không?
Bạn có chắc là muốn gửi bài test này không?

Số câu trả lời đúng/40

Số câu trả lời đúng/40
Thông tin gửi đi không thành công, vui lòng thử lại sau.
Nếu bạn cần liên hệ gấp, vui lòng gọi hotline
02873009677
Thời gian làm bài kiểm tra đã hết.
Cảm ơn bạn đã cố gắng.
