 02873009677
 contact@envyenglish.vn

1. Phân tích đề và nhóm thông tin
Đề bài
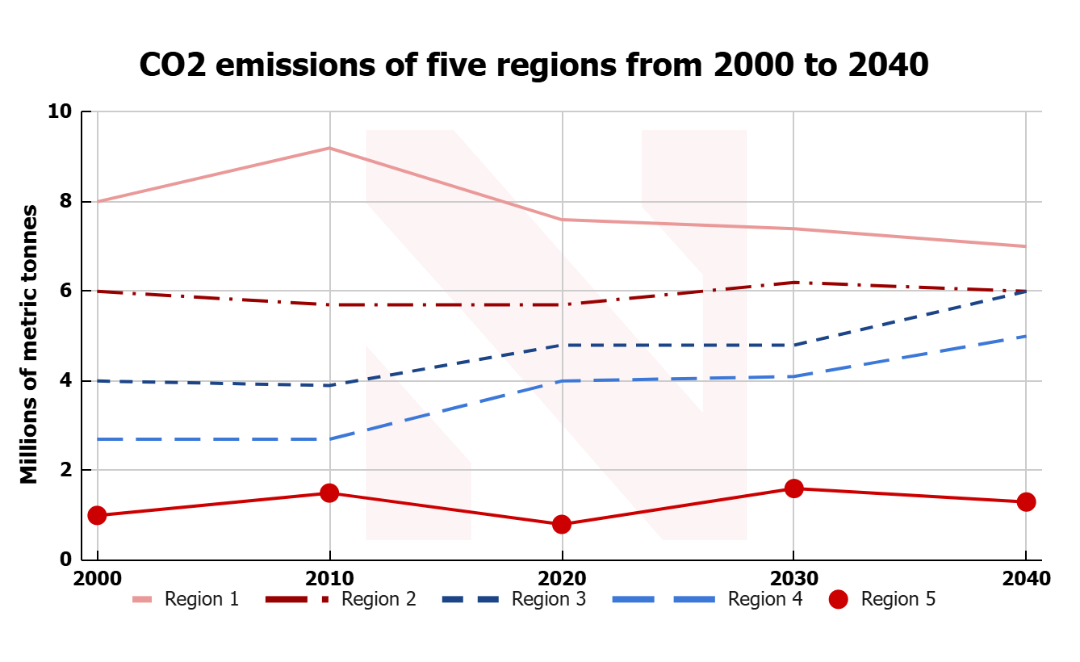
The graph below shows the CO2 emissions of five regions from 2000 to 2020, and predictions up to the year 2040.
Dạng biểu đồ
Line graph (Past data and future predictions)
Xác định đặc điểm tổng quan (Overview Features)
Đặc điểm nổi bật 1: Region 1 remained the largest emitter throughout the period despite a gradual decline after 2010, while Region 5 consistently produced the lowest level of emissions.
Đặc điểm nổi bật 2: Regions 3 and 4 followed upward trends over time, whereas Region 2 stayed relatively stable at around 6 million metric tonnes.
Chia nhóm dữ liệu cho các đoạn Thân bài (Data Grouping)
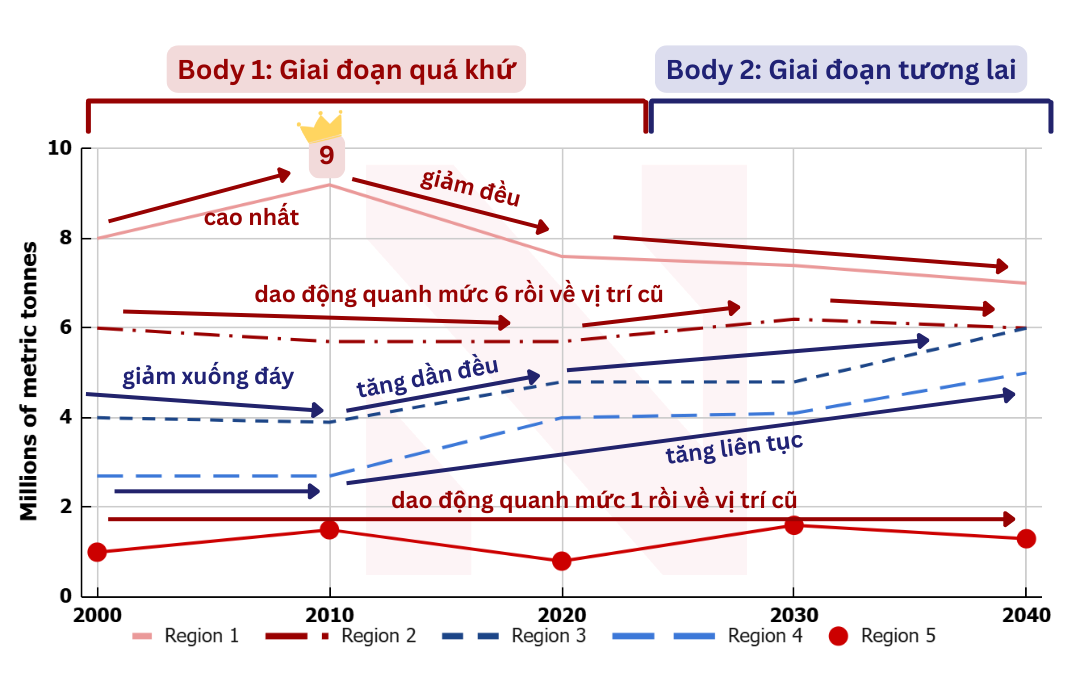
Body 1 Grouping: Historical trends (2000–2020)
Ý 1: Region 1, Region 2 and Region 5
Ý 2: Region 3 and Region 4
Body 2 Grouping: Predictions (2030–2040)
Ý 1: Region 1, Region 2 and Region 5
Ý 2: Region 3 and Region 4
Triển khai phân tích
Mở bài (Paraphrase)
The line graph illustrates CO2 emissions in five different regions between 2000 and 2020, together with projections for the following two decades.
(Tạm dịch: Biểu đồ đường minh họa lượng khí thải CO2 của năm khu vực từ năm 2000 đến năm 2020, đồng thời đưa ra dự báo cho hai thập kỷ tiếp theo.)
Tóm tắt tổng quan (Overview)
Overall, Region 1 remained the biggest source of CO2 emissions throughout the period, although its figures declined after peaking in 2010. By contrast, Region 5 consistently recorded the lowest emissions. Meanwhile, Regions 3 and 4 are expected to continue increasing, whereas Region 2 is projected to remain broadly stable.
(Tạm dịch: Nhìn chung, Region 1 luôn là khu vực phát thải CO2 lớn nhất trong suốt giai đoạn, mặc dù lượng khí thải giảm sau khi đạt đỉnh vào năm 2010. Ngược lại, Region 5 luôn có mức phát thải thấp nhất. Trong khi đó, Region 3 và Region 4 được dự báo sẽ tiếp tục tăng, còn Region 2 nhìn chung sẽ duy trì ổn định.)
2. Lập dàn ý chi tiết cho bài viết
Introduction
Paraphrase lại đề bài bằng cách thay thế shows → illustrates, CO2 emissions → carbon dioxide emissions, regions → areas, predictions → projections.
Overview
Đặc điểm chung:
Region 1 remained the highest emitter despite a downward trend after 2010.
Region 5 consistently produced the lowest emissions.
Điểm nổi bật:
Regions 3 and 4 showed overall growth.
Region 2 remained relatively stable throughout the period.
Body Paragraph 1
Trật tự sắp xếp: Region 1 → Region 2 → Region 5 → Region 3 → Region 4.
Topic sentence: Between 2000 and 2020, the five regions followed noticeably different emission trends.
Detail 1: Region 1 started at 8 million metric tonnes, peaked at just over 9 million in 2010, before falling to around 7.6 million in 2020. Region 2 remained almost unchanged at approximately 6 million tonnes throughout this period, while Region 5 fluctuated between 1 and 1.5 million tonnes and stayed the smallest emitter.
Detail 2: Region 3 declined slightly from about 4 million tonnes before rising steadily to nearly 5 million by 2020. Similarly, Region 4 remained stable at around 2.7 million tonnes in the early years before increasing gradually to 4 million tonnes.
Body Paragraph 2
Trật tự sắp xếp: Region 1 → Region 2 → Region 5 → Region 3 → Region 4.
Topic sentence: Looking ahead, contrasting trends are predicted among the five regions.
Detail 1: Region 1 is expected to continue declining to roughly 7 million tonnes by 2040, although it will remain the largest emitter. Region 2 is forecast to stay close to 6 million tonnes, while Region 5 will fluctuate only slightly at around 1–2 million tonnes.
Detail 2: In contrast, Regions 3 and 4 are projected to continue rising. Region 3 is likely to reach approximately 6 million tonnes by 2040, matching or slightly exceeding Region 2, whereas Region 4 is predicted to increase steadily to around 5 million tonnes.
3. Bài mẫu hoàn chỉnh
The line graph illustrates CO2 emissions in five different regions between 2000 and 2020, together with projections for the following two decades.
Overall, Region 1 remained the biggest source of CO2 emissions throughout the period, although its figures declined after peaking in 2010. By contrast, Region 5 consistently recorded the lowest emissions. Meanwhile, Regions 3 and 4 are expected to continue increasing, whereas Region 2 is projected to remain broadly stable.
Between 2000 and 2020, Region 1 rose from 8 million metric tonnes to a peak of just over 9 million in 2010 before falling to around 7.6 million tonnes by 2020. Region 2, by comparison, stayed almost unchanged at roughly 6 million tonnes. Region 5 remained the smallest emitter, fluctuating between approximately 1 and 1.5 million tonnes. Meanwhile, Region 3 fell slightly at first before climbing steadily to nearly 5 million tonnes, while Region 4 increased gradually from around 2.7 to 4 million tonnes.
Looking ahead, Region 1 is predicted to continue declining to about 7 million tonnes in 2040 but will still rank first. Region 2 is expected to remain close to 6 million tonnes, whereas Region 5 will continue to fluctuate slightly at around 1 to 2 million tonnes. By contrast, Regions 3 and 4 are forecast to keep rising, with Region 3 reaching approximately 6 million tonnes and Region 4 increasing to around 5 million tonnes by the end of the period.
(Word count: 193)
4. Lexical Resources List
New Vocabulary
CO2 emissions (noun phrase): lượng khí thải CO2
E.g. CO2 emissions increased steadily over the period.
carbon dioxide emissions (noun phrase): lượng phát thải khí carbon dioxide
E.g. Carbon dioxide emissions were measured in millions of metric tonnes.
projection (noun): dự báo
E.g. The graph includes projections until 2040.
peak at (verb phrase): đạt đỉnh
E.g. Emissions peaked at just over 9 million tonnes.
remain stable (verb phrase): duy trì ổn định
E.g. Region 2 remained stable throughout the period.
record the highest emissions (verb phrase): ghi nhận lượng phát thải cao nhất
E.g. Region 1 recorded the highest emissions.
fluctuate slightly (verb phrase): dao động nhẹ
E.g. Region 5 fluctuated slightly around 1.5 million tonnes.
upward trend (noun phrase): xu hướng tăng
E.g. Region 4 followed an upward trend.
declining trend (noun phrase): xu hướng giảm
E.g. Region 1 experienced a declining trend after 2010.
be projected to (verb phrase): được dự báo sẽ
E.g. Region 3 is projected to reach 6 million tonnes.
metric tonne (noun phrase): tấn mét
E.g. Figures are measured in millions of metric tonnes.
rank first (verb phrase): đứng đầu
E.g. Region 1 continued to rank first despite falling emissions.
Sentence Structures
The line graph illustrates + subject + over the period from + year + to + year +, together with projections until + year +. (Dùng để mở bài.)
E.g. The line graph illustrates CO2 emissions in five regions from 2000 to 2020, together with projections until 2040.
Overall, + subject + remained the highest, whereas + subject + consistently recorded the lowest figures. (Dùng để viết Overview.)
E.g. Overall, Region 1 remained the highest emitter, whereas Region 5 consistently recorded the lowest figures.
After peaking at + figure +, + subject + declined steadily to + figure +. (Dùng để mô tả xu hướng giảm sau khi đạt đỉnh.)
E.g. After peaking at just over 9 million tonnes, Region 1 declined steadily.
By contrast, + subject + remained relatively stable at around + figure + throughout the period. (Dùng để mô tả xu hướng ổn định.)
E.g. By contrast, Region 2 remained relatively stable at around 6 million tonnes throughout the period.
Looking ahead, + subject + is projected to continue increasing/decreasing, reaching + figure + by + year +. (Dùng để mô tả dự báo.)
E.g. Looking ahead, Region 4 is projected to continue increasing, reaching around 5 million tonnes by 2040.
Meanwhile, + subject + is expected to match or slightly exceed + subject + by the end of the period. (Dùng để mô tả hai đường có xu hướng hội tụ hoặc vượt nhau.)
E.g. Meanwhile, Region 3 is expected to match or slightly exceed Region 2 by the end of the period.
Nếu bạn đang bắt đầu từ con số 0 hoặc đã học nhưng “dậm chân tại chỗ”, Envy English Center có thể đồng hành cùng bạn:
Test trình độ miễn phí theo format IELTS để biết chính xác điểm mạnh – điểm yếu.
Nhận lộ trình học cá nhân hóa từ 0 → 6.5+, phù hợp tốc độ và mục tiêu.
Trực tiếp học với giáo viên IELTS 8.0+, chuyên “gỡ rối” Speaking & Writing – hai kỹ năng khó nâng band nhất.
Đặc biệt, khi đăng ký trong tuần này, bạn được tặng bộ từ vựng chuẩn IELTS band 7+.
📞 Hotline: 028 7300 9677 / 0948 197 270 (Zalo)
🌐 Website: envyenglish.vn
📍 Địa chỉ: 46/5 Tân Cảng, Phường Thạnh Mỹ Tây, Quận Bình Thạnh, TP.HCM


Thông tin gửi đi không thành công, vui lòng thử lại sau.
Nếu bạn cần liên hệ gấp, vui lòng gọi hotline
02873009677

Cảm ơn bạn đã gửi thông tin đến Envy English Center.
Chúng tôi sẽ liên hệ với bạn sớm nhất khi có thể.
Nếu bạn cần liên hệ gấp, vui lòng gọi hotline
02873009677
Thông tin gửi đi không thành công, vui lòng thử lại sau.
Nếu bạn cần liên hệ gấp, vui lòng gọi hotline
02873009677
Bạn đang có một bài test chưa hoàn thành.
Bạn có muốn tiếp tục bài test đó không?
Bạn có chắc là muốn gửi bài test này không?

Số câu trả lời đúng/40

Số câu trả lời đúng/40
Thông tin gửi đi không thành công, vui lòng thử lại sau.
Nếu bạn cần liên hệ gấp, vui lòng gọi hotline
02873009677
Thời gian làm bài kiểm tra đã hết.
Cảm ơn bạn đã cố gắng.
