 02873009677
 contact@envyenglish.vn


1. Phân tích đề và nhóm thông tin
Đề bài
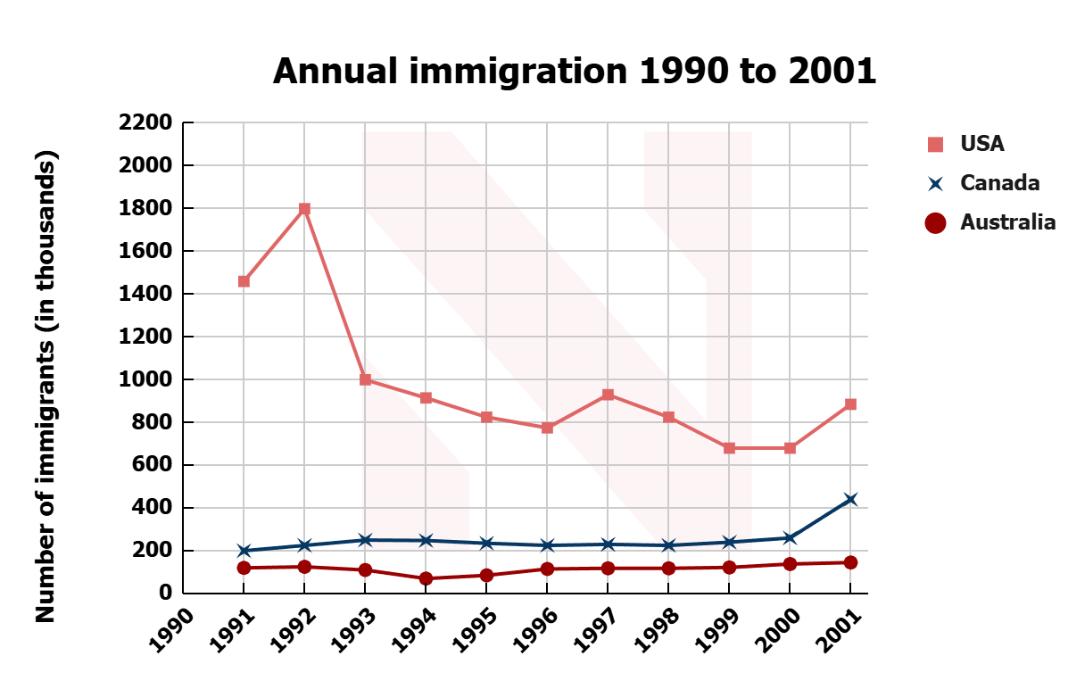
The graph provides information about the number of people who immigrated to three nations between 1990 and 2001.
Dạng biểu đồ
Multiple Line Graph
Xác định đặc điểm tổng quan (Overview Features)
Đặc điểm nổi bật 1: The USA recorded by far the highest immigration figures throughout most of the period, although its numbers fluctuated considerably and declined overall.
Đặc điểm nổi bật 2: Canada and Australia had much lower and relatively stable immigration levels, with Canada experiencing a sharp increase in the final year.
Chia nhóm dữ liệu cho các đoạn Thân bài (Data Grouping)
Body 1 Grouping: USA
Ý 1: Initial increase
Ý 2: Significant decline and brief fluctuations
Ý 3: Final recovery
Body 2 Grouping: Canada and Australia
Ý 1: Canada
Ý 2: Australia
Ý 3: Comparison between the two countries
Triển khai phân tích
Mở bài (Paraphrase)
The line graph compares the numbers of people who immigrated to the USA, Canada and Australia from 1990 to 2001.
(Tạm dịch: Biểu đồ đường so sánh số lượng người nhập cư vào Hoa Kỳ, Canada và Australia trong giai đoạn từ năm 1990 đến năm 2001.)
Tóm tắt tổng quan (Overview)
Overall, the USA received considerably more immigrants than Canada and Australia for most of the period, but its figure fluctuated substantially and ended well below its peak. By contrast, Canada and Australia experienced relatively little change, although Canada saw a sharp increase at the end of the period.
(Tạm dịch: Nhìn chung, Hoa Kỳ tiếp nhận nhiều người nhập cư hơn đáng kể so với Canada và Australia trong phần lớn giai đoạn, nhưng số liệu của nước này biến động khá mạnh và kết thúc thấp hơn nhiều so với mức đỉnh. Ngược lại, Canada và Australia có ít thay đổi hơn, mặc dù Canada ghi nhận mức tăng mạnh vào cuối giai đoạn.)
2. Lập dàn ý chi tiết cho bài viết
Introduction
Paraphrase lại đề bài bằng cách thay thế provides information about → compares, number of people who immigrated → numbers of immigrants, three nations → the USA, Canada and Australia, và between 1990 and 2001 → from 1990 to 2001.
Overview
Đặc điểm chung:
The USA had the highest immigration figures for most of the period.
Canada and Australia remained at much lower levels.
Điểm nổi bật:
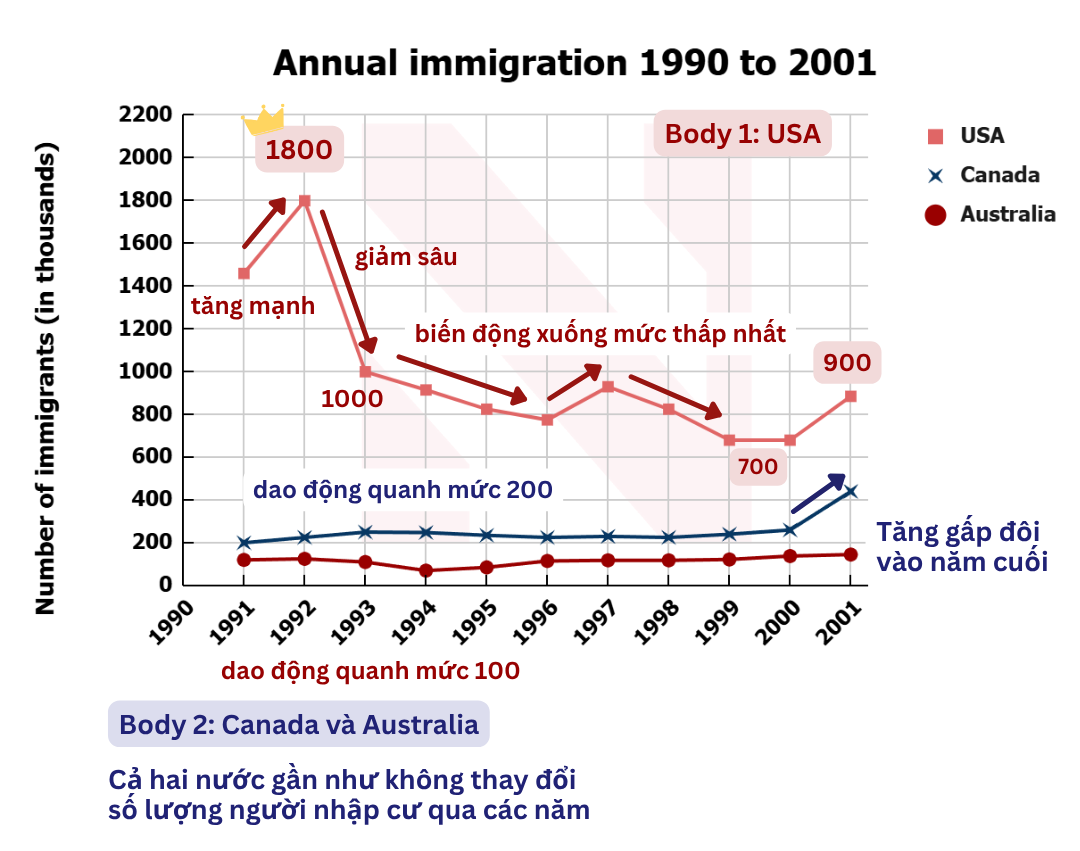
Immigration to the USA peaked at approximately 1,800 people before declining substantially.
Canada remained close to 200 for most of the period before doubling in the final year.
Australia fluctuated around 100 immigrants and remained relatively stable.
Body Paragraph 1
Trật tự sắp xếp: Initial figure → Peak → Decline → Final recovery.
Topic sentence: Immigration to the USA showed considerable fluctuations, with a sharp rise at the beginning followed by a prolonged decline.
Detail 1: In 1991, the number of immigrants to the USA was just over 1,400 per year, before reaching a peak of approximately 1,800 in the following year.
Detail 2: The figure then fell significantly, reaching a low of around 600 in 1999, despite a slight increase in 1997. It remained relatively stable between 1999 and 2000 before recovering to just above 800 at the end of the period.
Body Paragraph 2
Trật tự sắp xếp: Canada → Australia → Comparison.
Topic sentence: In contrast, Canada and Australia experienced much more stable immigration patterns and remained far below the USA.
Detail 1: Immigration to Canada stayed at approximately 200 people per year for most of the period, with the notable exception of a sharp increase in the final year, when the figure doubled.
Detail 2: Australia followed a similar but lower pattern, with the number of immigrants generally fluctuating around 100 per year. Overall, Canada consistently attracted roughly twice as many immigrants as Australia, apart from the final year when Canada's figure rose substantially.
3. Bài mẫu hoàn chỉnh
The line graph compares the numbers of people who immigrated to the USA, Canada and Australia from 1990 to 2001.
Overall, the USA received considerably more immigrants than Canada and Australia for most of the period, but its figure fluctuated substantially and ended well below its peak. By contrast, Canada and Australia experienced relatively little change, although Canada saw a sharp increase at the end of the period.
Immigration to the USA showed considerable fluctuations, with a sharp rise at the beginning followed by a prolonged decline. In 1991, the number of immigrants to the USA was just over 1,400 per year, before reaching a peak of approximately 1,800 in the following year. The figure then fell significantly, reaching a low of around 600 in 1999, despite a slight increase in 1997. It remained relatively stable between 1999 and 2000 before recovering to just above 800 at the end of the period.
In contrast, Canada and Australia experienced much more stable immigration patterns and remained far below the USA. Immigration to Canada stayed at approximately 200 people per year for most of the period, with the notable exception of a sharp increase in the final year, when the figure doubled. Australia followed a similar but lower pattern, with the number of immigrants generally fluctuating around 100 per year. Overall, Canada consistently attracted roughly twice as many immigrants as Australia, apart from the final year when Canada's figure rose substantially.
(Word count: 186)
4. Lexical Resources List
New Vocabulary
immigration figure (noun phrase): số liệu nhập cư
E.g. The USA recorded the highest immigration figures.
number of immigrants (noun phrase): số lượng người nhập cư
E.g. The number of immigrants to Canada remained stable.
receive immigrants (verb phrase): tiếp nhận người nhập cư
E.g. The USA received more immigrants than the other two countries.
reach a peak (verb phrase): đạt đỉnh
E.g. The figure reached a peak of approximately 1,800.
fall significantly (verb phrase): giảm đáng kể
E.g. Immigration to the USA fell significantly after 1992.
reach a low (verb phrase): chạm mức thấp
E.g. The figure reached a low of around 600 in 1999.
recover (verb): phục hồi
E.g. The number of immigrants recovered slightly at the end.
remain relatively stable (verb phrase): duy trì tương đối ổn định
E.g. Immigration to Canada remained relatively stable.
fluctuate around (verb phrase): dao động quanh mức
E.g. Australia's figure fluctuated around 100.
double (verb): tăng gấp đôi
E.g. Canada's immigration figure doubled in the final year.
prolonged decline (noun phrase): sự suy giảm kéo dài
E.g. The USA experienced a prolonged decline after its peak.
at the end of the period (prepositional phrase): vào cuối giai đoạn
E.g. The figure recovered slightly at the end of the period.
Sentence Structures
The line graph compares the numbers of + people + who immigrated to + countries + from + year + to + year. (Dùng để mở bài.)
E.g. The line graph compares the numbers of people who immigrated to three countries from 1990 to 2001.
Overall, + country + received considerably more immigrants than + countries + for most of the period. (Dùng để viết Overview.)
E.g. Overall, the USA received considerably more immigrants than Canada and Australia for most of the period.
The figure rose from + figure + to + figure + before reaching a peak of + figure. (Dùng để mô tả giai đoạn tăng và đạt đỉnh.)
E.g. The figure rose from just over 1,400 to approximately 1,800 before reaching a peak.
The figure then fell significantly, reaching a low of + figure + in + year. (Dùng để mô tả mức giảm mạnh.)
E.g. The figure then fell significantly, reaching a low of around 600 in 1999.
+ Country + remained relatively stable at around + figure +, with the exception of + event. (Dùng để mô tả xu hướng ổn định có ngoại lệ.)
E.g. Canada remained relatively stable at around 200, with the exception of a sharp increase in the final year.
+ Country + followed a similar but lower pattern, with + figure + fluctuating around + figure. (Dùng để so sánh hai xu hướng tương tự.)
E.g. Australia followed a similar but lower pattern, with immigration fluctuating around 100.
Overall, + country + consistently attracted roughly + comparison + as many immigrants as + country. (Dùng để đưa ra so sánh tổng quát.)
E.g. Overall, Canada consistently attracted roughly twice as many immigrants as Australia.
Nếu bạn đang bắt đầu từ con số 0 hoặc đã học nhưng “dậm chân tại chỗ”, Envy English Center có thể đồng hành cùng bạn:
Test trình độ miễn phí theo format IELTS để biết chính xác điểm mạnh – điểm yếu.
Nhận lộ trình học cá nhân hóa từ 0 → 6.5+, phù hợp tốc độ và mục tiêu.
Trực tiếp học với giáo viên IELTS 8.0+, chuyên “gỡ rối” Speaking & Writing – hai kỹ năng khó nâng band nhất.
Đặc biệt, khi đăng ký trong tuần này, bạn được tặng bộ từ vựng chuẩn IELTS band 7+.
📞 Hotline: 028 7300 9677 / 0948 197 270 (Zalo)
🌐 Website: envyenglish.vn
📍 Địa chỉ: 46/5 Tân Cảng, Phường Thạnh Mỹ Tây, Quận Bình Thạnh, TP.HCM


Thông tin gửi đi không thành công, vui lòng thử lại sau.
Nếu bạn cần liên hệ gấp, vui lòng gọi hotline
02873009677

Cảm ơn bạn đã gửi thông tin đến Envy English Center.
Chúng tôi sẽ liên hệ với bạn sớm nhất khi có thể.
Nếu bạn cần liên hệ gấp, vui lòng gọi hotline
02873009677
Thông tin gửi đi không thành công, vui lòng thử lại sau.
Nếu bạn cần liên hệ gấp, vui lòng gọi hotline
02873009677
Bạn đang có một bài test chưa hoàn thành.
Bạn có muốn tiếp tục bài test đó không?
Bạn có chắc là muốn gửi bài test này không?

Số câu trả lời đúng/40

Số câu trả lời đúng/40
Thông tin gửi đi không thành công, vui lòng thử lại sau.
Nếu bạn cần liên hệ gấp, vui lòng gọi hotline
02873009677
Thời gian làm bài kiểm tra đã hết.
Cảm ơn bạn đã cố gắng.
